
Google Ads Competitor Analysis: Which Data to Trust

Google Ads competitor analysis works when you separate what you can observe from what a tool estimates. Google shows you real auction data about advertisers who competed against you, and a public archive of their ad creatives. Everything else- spend figures, keyword lists, traffic numbers- is modeled from sampled data and should be treated as a directional signal, not a fact. Advertisers who confuse the two build strategy on numbers nobody ever measured.
TL;DR
Auction Insights is observed data. It shows advertisers who actually appeared in auctions with you. It never shows their bids, budgets, or targeting.
The Ads Transparency Center is observed data. It shows creatives from verified advertisers, up to a year of history, with no spend or performance attached.
Semrush, SpyFu, iSpionage, and Similarweb are modeled. Useful for direction and discovery. Not accurate to the dollar or the keyword.
A competitor's impression share in your report is not their market share. It only covers auctions that overlapped with yours.
Location changes what you see. A marketer in London researching US competitors sees a different SERP than a customer in Dallas.
A proper report records confidence level per line. If every row looks equally certain, the report is misleading whoever reads it.
What Google Ads competitor analysis can and cannot reveal
The single most useful table in this article:
What you want to know | Can you observe it? | Source |
Which advertisers compete in your auctions | Yes | Auction Insights |
How often you appear alongside them | Yes | Auction Insights (overlap rate) |
Whether they outrank you | Yes | Auction Insights (position above rate) |
Their live and recent ad creatives | Yes | Ads Transparency Center |
How long an ad has been running | Yes | Ads Transparency Center |
Their landing pages and offers | Yes | Direct visit |
Their exact ad spend | No | Estimated only |
Their exact keyword list | No | Estimated only |
Their bids or bid strategy | No | Not available anywhere |
Their audience and demographic targeting | No | Not available (non-political ads) |
Their conversion rates or CTR | No | Not available anywhere |
Everything in the "No" column is where third-party tools make their money, by modeling it. That modeling is legitimately useful. It is not measurement.
Auction Insights: reading it without misreading it
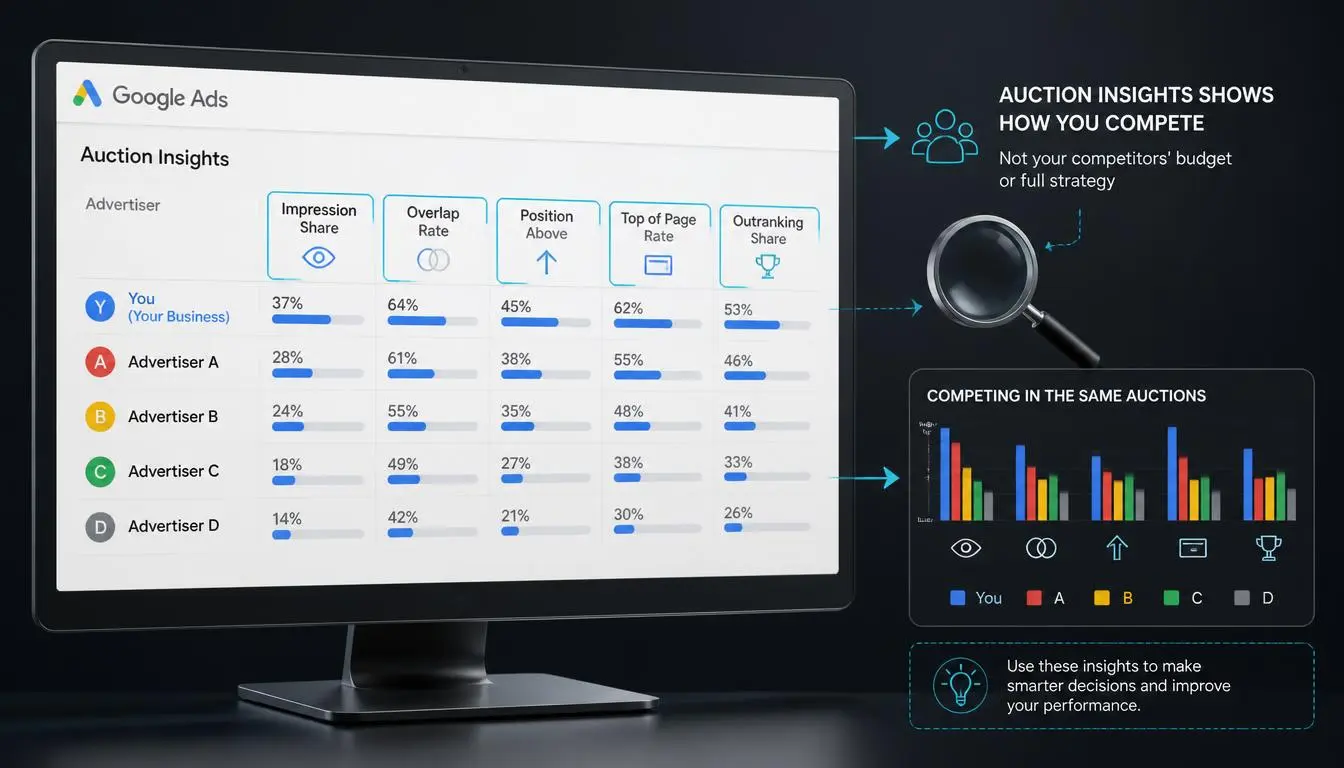
Auction Insights is the only place you see verified data about advertisers who genuinely competed against you. Google's Auction Insights documentation covers six metrics for Search campaigns: impression share, overlap rate, position above rate, top of page rate, absolute top of page rate, and outranking share.
Two misreadings cost advertisers the most:
"Their impression share is 74%, so they own the market." No. Google states plainly that the impression share shown for a competitor in your report may differ from what that competitor sees in their own account, because your eligible auctions and theirs only partially overlap. A competitor showing 100% in your report might be running at 50% in their own.
"High overlap rate means they're beating us." Overlap rate just means you keep showing up together. Pair it with position above rate before drawing a conclusion. High overlap with low position above rate is a good sign; you're consistently beating an active rival.
Why a competitor is missing from the report: the report includes only advertisers and campaigns that clear a minimum activity threshold for the selected period. A blank report usually means insufficient data, not an absence of competition. Widen the date range before concluding anything. Practitioners commonly cite a 10% impression share floor; treat that as an observed pattern rather than a documented rule.
The workflow that actually pays: sort by overlap rate monthly and watch for new domains climbing the list. That's your early warning on a competitor increasing spend, before it shows up in your CPCs.
The Google Ads Transparency Center: more useful than most advertisers realize
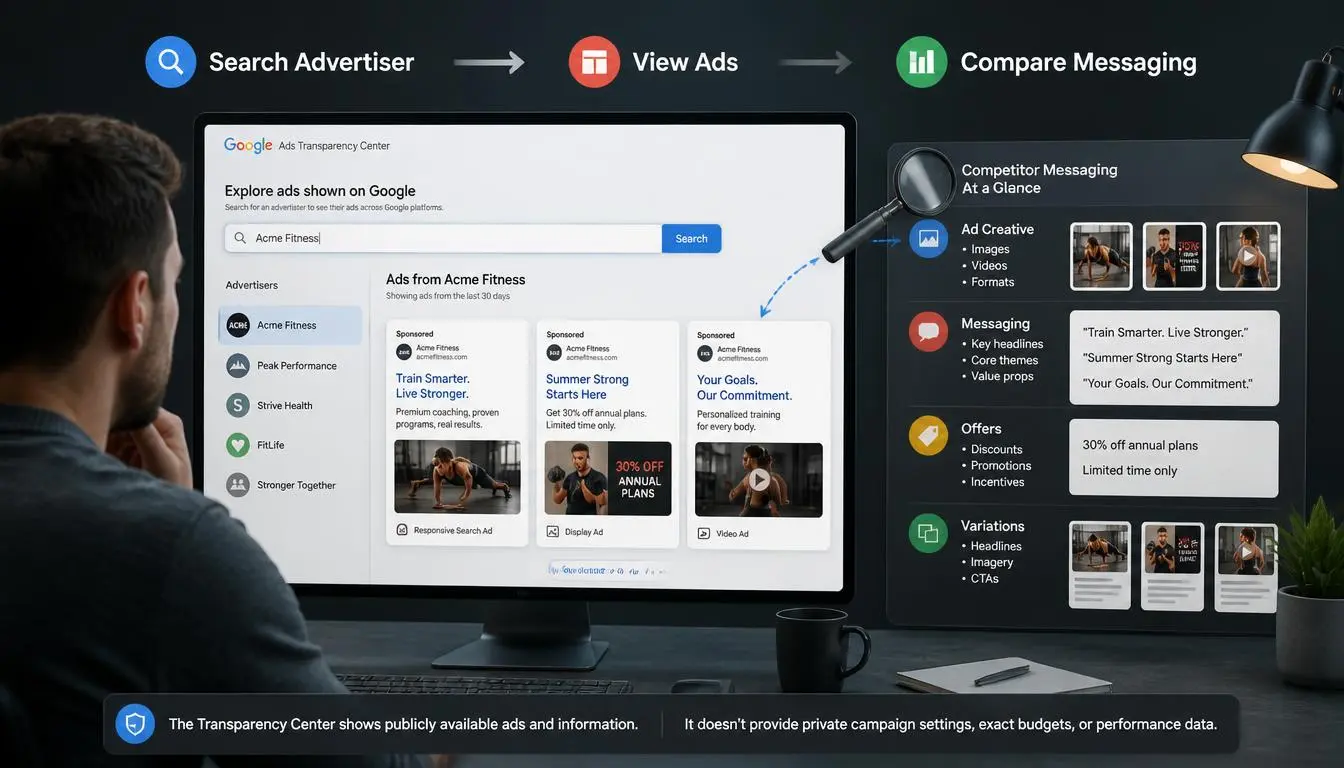
Google's public ad archive shows creatives from verified advertisers across Search, YouTube, and Display, free, with no login. Search by brand name or domain at adstransparency.google.com, then filter by region, date range, and format.
Three things most guides get wrong:
History is roughly a year, not 30 days. Long enough to spot seasonal patterns and message shifts.
Data isn't the same in every region. Ads shown in the EU expose targeting and reach information that the US view does not surface. If your competitor advertises on both sides of the Atlantic, filtering to an EU region can reveal what the US filter will not. This is a genuine asymmetry worth exploiting.
An empty result usually signals something. Every advertiser must complete Google's verification, and outside Europe and Türkiye, unverified advertisers' ads do not appear at all. If a competitor returns nothing, the likeliest explanations are that they advertise under a different legal entity, run through an agency account, or haven't verified, not that the tool failed.
What it will never show you: spend, keywords, bids, audiences, CTR, conversions. For ordinary commercial advertisers, spend disclosure applies only to political ads in certain regions. Ad longevity is the closest thing to a performance signal; an ad running for eight months is probably working, and that's an inference, not a metric.
Google Ads competitor analysis tools: choose by question, not by ranking
Stop asking which tool is best. Ask which question you're trying to answer.
Tool | Answers well | Cannot reliably answer | Best for |
Auction Insights | Who competes with you, how often, who ranks above | Anything about their account internals | Everyone running Search or Shopping |
Ads Transparency Center | What creatives run, how long, which regions | Spend, keywords, performance | Creative and messaging research |
Keyword Planner | Search volume ranges, competition indices | Which keywords a specific rival bids on | Sizing opportunity, not spying |
Semrush | Keyword and domain discovery at scale | Exact spend or complete keyword coverage | Agencies handling many accounts |
SpyFu | Historical ad copy and long keyword timelines | Current-week accuracy; smaller markets | Long-run PPC pattern analysis |
iSpionage | Competitor ad copy and landing page tracking | Comprehensive coverage outside the US | SMBs on a tighter budget |
Similarweb | Traffic composition and channel mix | Paid-search granularity | Market sizing and entry research |
The estimate problem, stated plainly. Third-party PPC tools infer competitor activity from sampled SERP scrapes, clickstream panels, and modeled CPC data. Different tools will hand you materially different spend figures for the same competitor in the same month. Neither is wrong; they're different models. Use them to rank competitors by relative activity, spot keywords you hadn't considered, and detect direction of travel. Never quote an estimated spend figure in a client deck without labeling it as an estimate; it's the fastest way to lose credibility when the client's own rep contradicts it.
Independent proxy and data-infrastructure research from Proxyway offers useful context on how sampled collection methods vary in quality, which is ultimately what drives the spread between these tools' estimates.
A nine-step Google Ads competitor analysis workflow
Define the real competitive set. Your business competitors and your auction competitors overlap less than you'd assume. Start from Auction Insights sorted by overlap rate, not from a list someone wrote in a strategy deck.
Read Auction Insights properly. Segment by device and by month. Look for movement, not absolutes.
Pull creatives from the Transparency Center. Note run duration. The old ads are the ones that work.
Run keyword discovery in a third-party tool. Label the output as a hypothesis list, not a competitor's keyword list.
Cluster their messaging. What promise repeats across creatives? That's their tested positioning.
Audit their landing pages. Look at the above-the-fold offer, form length, proof elements, page speed, and mobile behavior.
Compare offers and CTAs against yours. Free trial vs demo vs quote changes the entire auction economics.
Check geographic variation. Covered below, this is where most audits stop too early. Read about geo targeting
Assign confidence, then schedule the repeat. Monthly for active accounts, quarterly for stable ones.
The competitor SEO and Google Ads strategy report framework
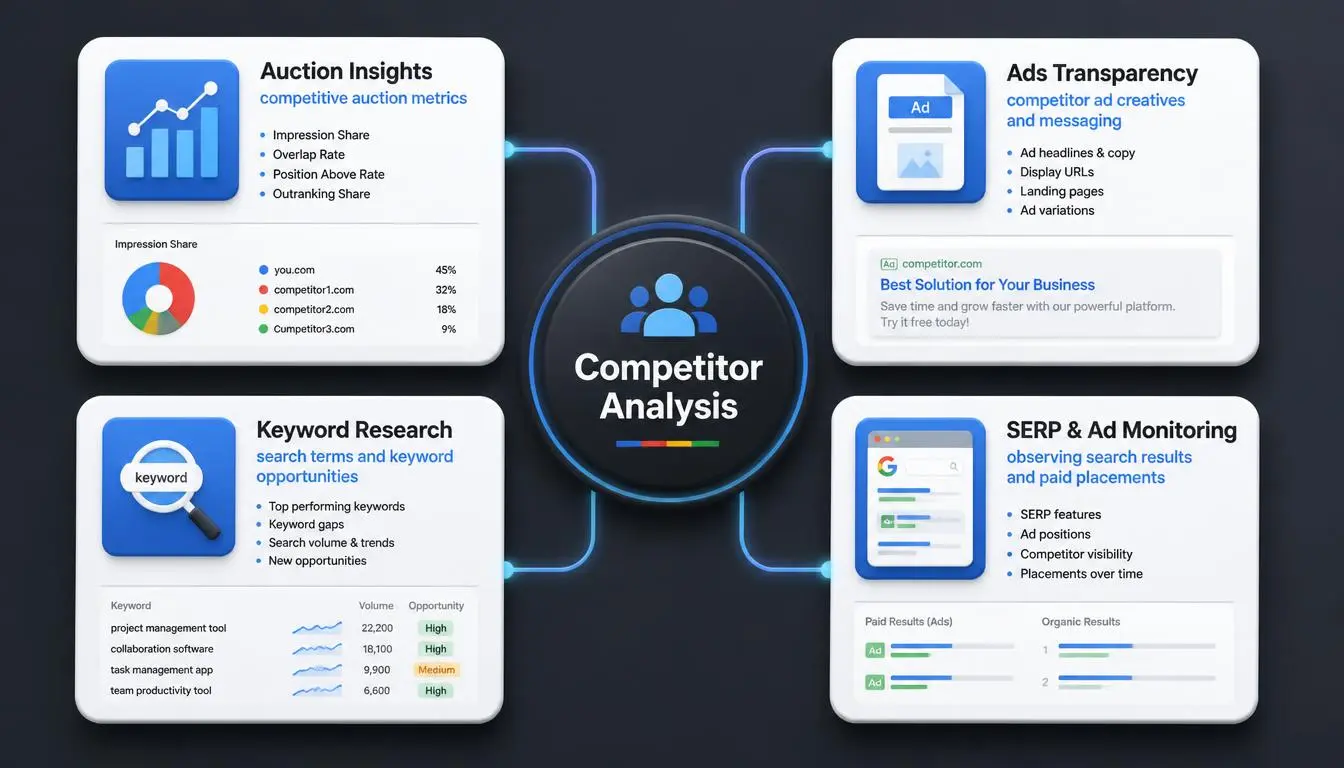
Most agencies deliver a wall of screenshots. This is a better structure, one row per competitor, with evidence and confidence as mandatory columns:
Field | What goes in it | Typical confidence |
Competitor | Verified legal entity, not just brand | High |
Auction overlap | Overlap rate, position above rate | High, observed |
Ad creatives | Live ads, run duration, format mix | High, observed |
Ad messaging | Recurring promise, tone, offer type | High (interpretation) |
Landing page | Structure, offer, form, proof | High, observed |
CTA | Exact wording and commitment level | High |
Paid keywords | Tool-estimated list | Low, modeled |
Estimated spend | Tool figure, range, not a point | Low, modeled |
Organic keywords | Ranking overlap with paid | Medium |
Geographic targeting | Regions ads appeared | Medium |
Device split | Where observable | Low |
Funnel structure | Post-click journey | Medium |
Strengths/weaknesses | Analyst judgement | Interpretation |
Opportunity gap | What they're not covering | Interpretation |
The confidence column is the whole point. A report where estimated spend and observed overlap rate sit in identical formatting invites the reader to trust both equally. They shouldn't.
Why location changes what you see
Google Search results and ad exposure vary by location, device, language, query phrasing, time, and personalization. Two people typing the same query from different cities can see different advertisers in different order.
For competitor research, this creates a concrete problem. A marketer in London auditing a client's USA competitors sees a SERP shaped by their own location. Search settings help; they don't replicate the experience. Competitive-intelligence databases return aggregated, often national-level data, which smooths out exactly the regional differences you're trying to find.
This matters most when:
A competitor runs different offers or pricing by state
Landing pages serve localized content based on IP
A national brand competes against local advertisers in specific metros
You're entering the US market and need to see what a real US customer sees
You're verifying that your own ads and pages render correctly in target regions
Where proxy infrastructure fits into Google Ads competitor analysis
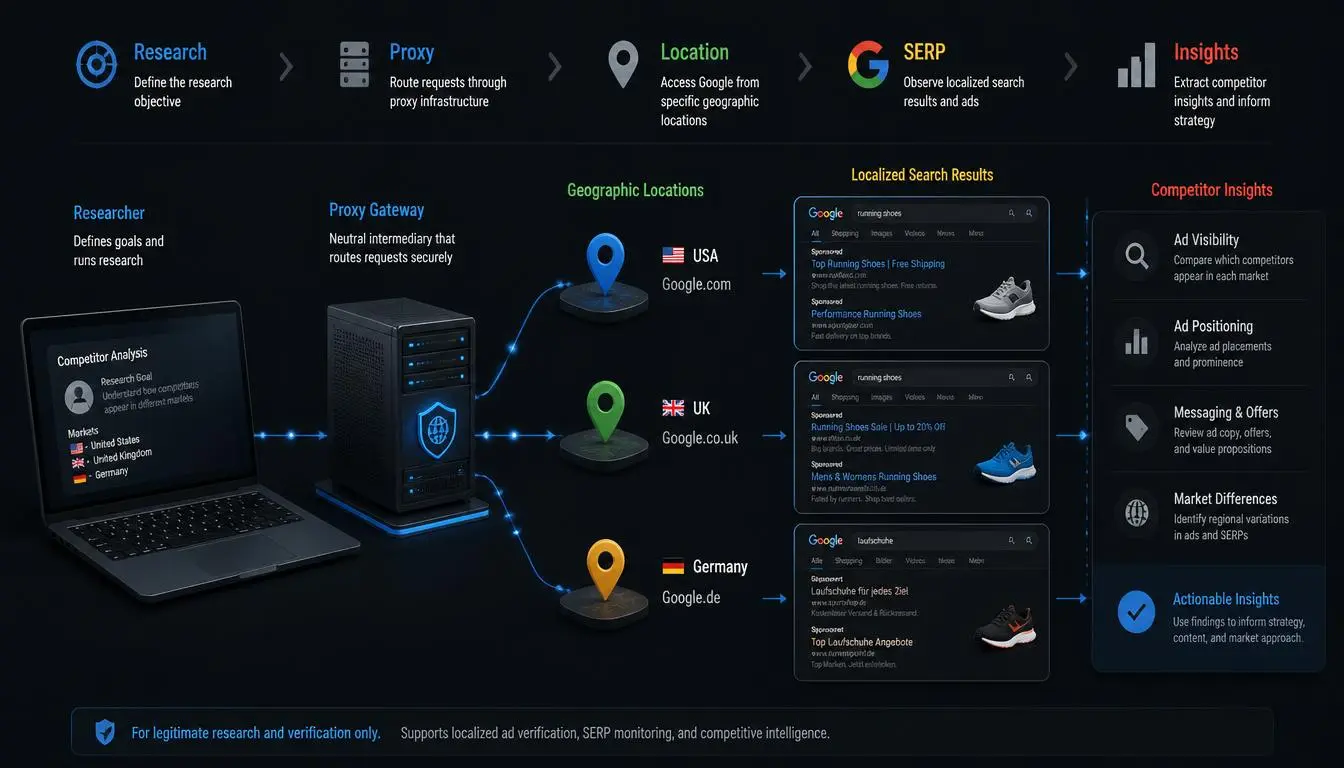
The problem: competitive-intelligence tools show modeled, aggregated data.
The limitation: they don't tell you what a user in Chicago, Phoenix, or Atlanta sees right now, on a phone, on a carrier connection.
The complement: controlled geographic verification, checking localized pages and content from a real IP in the target market.
This supplements Auction Insights and the Transparency Center, never replaces them. And to be explicit: proxy infrastructure does not reveal private competitor data, does not show anyone's budget, and clicking competitors' ads is ad fraud regardless of how the traffic is routed.
Legitimate uses: verifying US-localized page experiences, checking regional landing pages and offers, localization QA, mobile-experience verification, and authorized market research.
Why mobile IPs behave differently: US mobile carriers route many subscribers through shared address pools, so a mobile IP looks like ordinary consumer traffic to a site's geolocation logic, often matching what a real US mobile customer sees more closely than a datacenter IP does.
Relevant CyberYozh options with verified 2026 pricing:
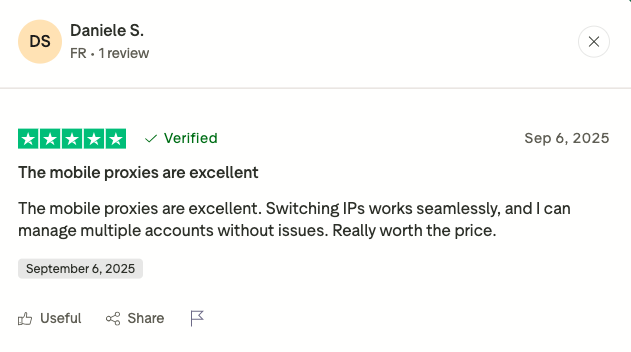
US mobile proxies from $3.5/day (dedicated), $1.7/day (shared)
Real LTE/5G carrier connections, HTTP and SOCKS5 with UDP support, unlimited bandwidth, manual or API-triggered IP rotation. Day-rate billing makes sustained verification predictable, roughly $51/month regardless of volume.
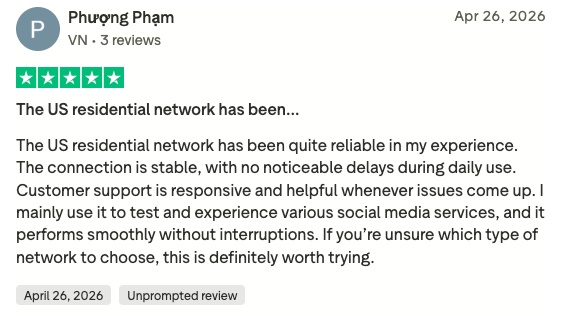
Rotating residential proxies from $2/GB
Pay-as-you-go across a pool advertised at 100+ countries, with country and region targeting included and configurable rotation windows. Suited to short localized checks across many markets.
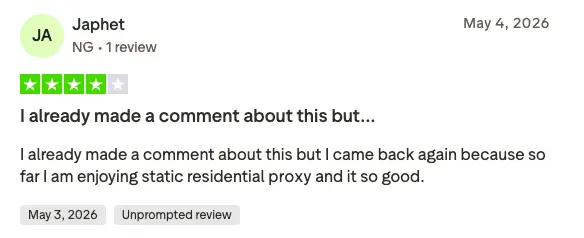
Static ISP residential proxies from $5.29/month
Dedicated IPs on real consumer ISPs over SOCKS5, unlimited traffic. For monitoring the same competitor page from a consistent location over time.
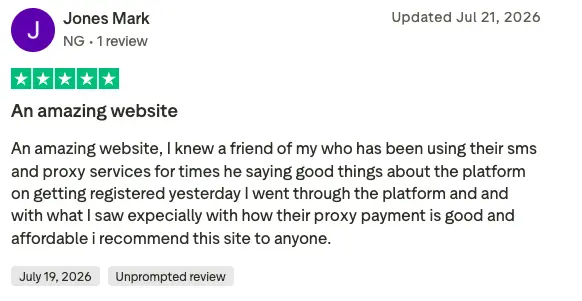
Documented API with a Swagger reference, plus integration guides for Selenium, Playwright, Scrapy, and Postman, if verification is scripted rather than manual. Trustpilot sits at 4.7–4.8; support runs 08:00–22:00 GMT+0.
Common mistakes
Quoting estimated spend as fact. The single fastest way to lose a client's trust.
Treating a competitor's impression share as market share. It only covers overlapping auctions.
Analyzing competitors who aren't in your auctions. Business rivals ≠ auction rivals.
Assuming an empty Transparency Center result means no ads. Usually a verification or entity-name issue.
Copying a competitor's ad copy. You inherit their positioning and none of their data.
Running the audit once. Competitive landscapes shift monthly; a one-off audit is a snapshot of a moving object.
Auditing only from your own location. You're seeing your SERP, not your customer's.
The takeaway
Good Google Ads competitor analysis is less about access to more data and more about being honest about what each source proves. Auction Insights tells you who you're fighting. The Transparency Center tells you what they're saying and how long they've said it.
Third-party tools tell you where to look next. Geographic verification tells you what your actual customer sees. Label each accordingly, assign confidence honestly, and repeat on a schedule; that's a competitive-intelligence process, not a one-off screenshot exercise.